Estimated Reading Time: 8 minutes
The right column tells a business story. The left column tells a hobby story. Promotions go to the right column.
TL;DR: To document safety achievements for performance reviews and promotions, track three categories of results: incident rate reductions, cost savings, and behavioral changes. Translate each into executive language using dollar values, percentages, and benchmarks against BLS averages. Compile a one-page annual impact report with quantified wins, leading indicators, and program initiatives so leadership can see your business value at a glance.Here is exactly how to document safety achievements for performance reviews and promotions: quantify your impact in three buckets (incident reduction, dollars saved, behavior change), then translate those numbers into the language your executive team already uses. If you can’t put a percentage or a dollar sign next to a safety win, leadership can’t reward you for it. And this is the mistake we make. Most safety professionals walk into their review with a list of activities (audits run, trainings delivered, inspections completed) instead of business outcomes. Your operations counterpart isn’t getting promoted for “ran 12 meetings.” They’re getting promoted for “improved throughput 14% and saved $230K.” You need to play the same game.
Key Takeaways
- Track three result categories: incident rate reductions, cost savings, and behavioral or cultural changes. Anything that doesn’t fit one of these buckets probably doesn’t belong on your review.
- Lead with numbers, not activities. “Reduced TRIR from 3.4 to 2.1” beats “ran the safety committee” every single time.
- Benchmark against BLS data. The 2023 private-industry TRC rate was 2.7. If you beat the national average, say so.
- Translate to dollars. OSHA estimates a $4 to $6 return for every $1 invested in safety, and indirect injury costs run 2 to 3 times direct costs.
- Compile a one-page annual impact report. Make it skimmable. Executives will not read a 14-page narrative.
- Document the leading indicators too. Near-miss reporting rates, training completion, and observation frequency show you’re building a system, not catching luck.
The 3 Types of Safety Results That Belong in Every Performance Review
There are really only three types of safety results that move the needle in a promotion conversation. Everything else is filler. When you sit down to draft your performance review, sort your year into these three buckets before you write a single bullet point. This is the framework I teach inside the Safety Leadership Academy, because most safety professionals are doing the work… they just aren’t capturing it in a way the executive team can grade.Incident Rate Reductions
Lagging indicators still matter, even though I push hard on leading indicators inside the Safety Management Cycle. Executives understand TRIR, DART, and lost-time case rates because those numbers tie directly to insurance premiums and operational disruption. Document your year-over-year change in each rate, then benchmark against the BLS private-industry average. The 2023 BLS data put the total recordable case rate at 2.7 per 100 full-time workers. If your facility went from 3.4 to 2.1, that’s not just an improvement… that’s a measurable move from below-average to above-average performance. Always pair the number with the context. “Reduced TRIR 38% year-over-year, now performing 22% better than the 2023 BLS private-industry average.” That sentence does more work in a review than ten bullets about meetings.Cost Savings and Avoided Costs
This is where most safety professionals leave the biggest money on the table. You did the work that prevented incidents, lowered workers’ comp claims, reduced overtime, and cut quality scrap. But if you don’t translate the prevention into a dollar figure, leadership counts it as zero. According to OSHA’s Business Case for Safety and Health, effective programs return $4 to $6 for every $1 invested. NSC injury cost data lets you calculate avoided costs per recordable injury. Use a conservative number and show your math. Build a simple cost-avoidance line for the year: “Prevented an estimated 5 recordable injuries vs. our three-year baseline, representing approximately $X in avoided direct and indirect costs based on NSC Injury Facts estimates.” That kind of statement gets quoted in board meetings.Behavioral and Cultural Change
The third bucket is the one that proves you’re a systems-builder, not a firefighter. Capture leading indicator improvements: near-miss reporting frequency, safety observation completion, training closure rates, and corrective action turnaround time. NIOSH explicitly recommends tracking both outcome metrics and process metrics to demonstrate program effectiveness. ASSP guidance on leading with safety and health metrics says the same thing… pair leading indicators with lagging results so leadership sees the full picture. Also document survey or perception data when you have it. Employee engagement scores around safety, supervisor accountability ratings, and culture audit results all belong here. Behavior change is the hardest result to win and the easiest to lose if you don’t write it down.How to Write Safety Achievements in Executive Language
Writing for executives is its own skill, and it’s the gap I see most often when reviewing student materials. Your VP of Operations doesn’t care that you “facilitated cross-functional collaboration.” They care that you “reduced production downtime from safety incidents by 31%.” Translation is the entire game. Same accomplishment, two completely different reviews.The Result Statement Format
Use this structure for every bullet on your review: [Action verb] + [specific metric or business impact] + [dollar figure or percentage] + [comparison or benchmark] Compare these:| Safety Language | Executive Language |
|---|---|
| Led the safety committee | Built a peer-led safety committee that closed 87% of corrective actions within 30 days, up from 42% the prior year |
| Reduced injuries | Cut TRIR from 3.4 to 2.1 (38% reduction), saving an estimated $185K in workers’ comp and indirect costs |
| Improved training | Raised supervisor safety training completion from 71% to 98%, supporting a 24% drop in supervisor-area incidents |
| Worked on culture | Increased near-miss reporting 4.2x, identifying 73 hazards before they caused recordable injuries |
Tie Every Win to a Business Outcome
When talking to management, connect every safety result to one of four levers executives care about: profit, productivity, retention, or risk. If a result doesn’t tie to one of those four, either re-frame it or cut it. This is the same logic we cover in the business case for safety. You’re not selling safety, you’re selling cost avoidance, throughput, and reduced executive risk. The numbers do the persuading for you.THE ALL-ACCESS PASS RESOURCE PAGE
Get all the FREE templates, safety management resources, PDFs, spreadsheets, and more...
The Annual Safety Impact Report (Sample Format)
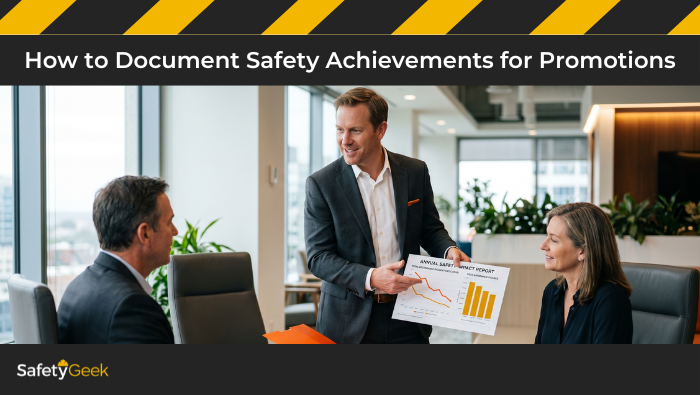
Once a year, compile everything into a one-page Annual Safety Impact Report. Send it to your direct supervisor two weeks before your review. Hand-deliver a printed copy in the meeting. Use this skeleton:- Headline metric – one number that summarizes your year (e.g., “$340K in avoided injury costs and 38% TRIR reduction”).
- Top 3 quantified wins – your best three result statements from the three buckets above.
- Leading indicator scorecard – table showing near-miss reporting, training completion, observation frequency, and corrective action closure for the year, with year-over-year change.
- Program initiatives shipped – bulleted list of major projects (new JHA program, supervisor training rollout, etc.) with the result each one delivered.
- Next-year focus areas – three priorities tied to business goals you’ve already heard from leadership.
Common Mistakes That Tank Your Promotion Case
A few patterns I see over and over with safety professionals who feel stuck at their level: Documenting activities instead of outcomes. “Ran 24 toolbox talks” is an input. “24 toolbox talks tied to a 47% drop in hand injuries on the affected shift” is an outcome. Saving documentation for review week. By then it’s too late, and you’re reconstructing from memory. Keep a running document and update it monthly. Ten minutes a month beats six hours of panic in March. Hiding the dollar figures. Some safety leaders feel awkward putting cost-avoidance numbers next to injury prevention. Don’t do that. Executives think in dollars, and translating your impact is respect for their language. Confusing “we” with “I.” In team accomplishments, name your specific contribution. “Led the cross-functional team that…” beats “We had a great year.” Promotions reward individuals, not departments. Skipping the benchmark. A 2.1 TRIR is meaningless until you compare it to the 2.7 BLS average or your prior-year baseline. Always benchmark. If you’re trying to break into a higher-level safety role, this documentation discipline is the single biggest gap I see between people who get promoted and people who plateau. The work might be identical, but the documentation isn’t.Frequently Asked Questions About Documenting Safety Achievements
What if my company doesn’t track TRIR or DART?
Start tracking it yourself with a simple spreadsheet. Pull your OSHA 300 log, calculate the rates monthly, and present them in your review. You’ll often be the first person at your facility putting structured numbers in front of leadership, which itself becomes a documented achievement worth highlighting.How do I document safety wins if there were no incidents to “prevent”?
Shift to leading indicators and cost-avoidance modeling. Document training completion, near-miss reporting growth, observation frequency, and audit closure rates. Then use a three-year incident baseline and NSC injury cost data to estimate avoided losses. No incidents is the goal, not the absence of a story.How often should I update my safety achievement log?
Monthly, in 10 to 15 minutes. Open a running document the first week of every month and record your top three wins, leading-indicator movement, and any program milestones. This habit alone will make your annual review stronger and remove the scramble during promotion conversations.Should I share my impact report before my review or in the meeting?
Send it to your direct supervisor two weeks before the review, then bring a printed copy to the meeting. The advance copy lets them prepare while the printed copy anchors the conversation. Reviewers who have skim time before the meeting consistently advocate harder for their direct reports.What if my manager doesn’t care about safety metrics?
Translate to their language instead. If they care about production, frame safety results as uptime preserved. If they care about HR, frame them as turnover reduction and reduced workers’ comp claims. The metrics don’t change, only the headline does.How do I document behavioral and cultural change without survey budget?
Use proxy metrics like near-miss reporting volume, voluntary safety suggestion frequency, supervisor coaching documentation, and training engagement scores. You can also pull qualitative quotes from incident debriefs and supervisor 1:1s. Culture leaves fingerprints even when you can’t afford a formal survey.Now It’s Your Turn
Your safety results are real. The only question is whether you’ve documented them in a way that earns the promotion they deserve. Start this week with three steps:- Open a running achievement log today. A simple Google Doc with three headers (Incident Reduction, Cost Savings, Behavioral Change) is enough. Add your top wins from the last six months while they’re fresh.
- Translate one current win into executive language. Pick your single best result from the last quarter. Rewrite it using the Action + Metric + Dollar + Benchmark format. Notice how different it sounds.
- Build your one-page Annual Safety Impact Report skeleton. You don’t need the data yet, just the structure. Then fill it as the year unfolds.
Hi, I'm Brye (rhymes with sky)! I am a self-proclaimed safety geek with two decades of general industry safety experience. Specializing in bringing safety programs to a world-class level and building a safety culture, I have trained and coached many safety managers, just like you, on how to effectively manage workplace safety in the real world. I would love to help you too.