Estimated Reading Time: 8 minutes
Most manufacturers treat safety as a cost center. The numbers tell a different story. Every dollar spent on workplace safety returns $2 to $6 in prevented workers’ comp claims, downtime, turnover, and quality losses. This guide shows you how to reframe workplace safety as a profit center in manufacturing, with the ROI data, real numbers, and talking points your CFO will actually respect.
Reframing workplace safety as a profit center in manufacturing starts with one shift in language. Stop calling safety an expense. Start calling it an investment that protects the plant’s productive capacity, margin, and headcount.
The data backs you up. OSHA’s Business Case for Safety cites Liberty Mutual data showing employers pay more than $1 billion every week in direct workers’ comp costs for serious nonfatal injuries. That money comes straight off the P&L.
If you’ve sat in a budget meeting watching your safety request get cut while marketing and operations walk out with full funding, you know how this feels. It’s not that leadership doesn’t care about people. It’s that nobody has shown them how safety actually moves the numbers they care about.
That’s what this guide fixes. You’ll see the real ROI math, the indirect costs that get ignored, and the three-number conversation that turns a CFO from skeptic to supporter.
Key Takeaways
- Safety investments return $2 to $6 for every $1 spent when direct and indirect costs are counted.
- Indirect costs of an injury can run 2 to 10 times the direct workers’ comp cost.
- A single lost-time injury in manufacturing often costs $40,000 to $60,000 once everything is added up.
- The “cost center” label hides safety’s impact on OEE, turnover, and insurance premiums.
- Executives respond to three numbers: avoided claims, recovered uptime, retained headcount.
- Your Safety Management System is also a margin-protection system.
Why the Cost Center Story Hurts Safety (and Profits) Every Year
For decades, manufacturing leaders have parked safety inside the same mental bucket as compliance, legal, and HR. Necessary, but a drag on margin. That framing made sense in the 1970s when OSHA was new and most companies treated safety as paperwork.
It doesn’t hold up anymore. The plants running the lowest injury rates also run the highest OEE, the lowest turnover, and the best quality numbers. That’s not a coincidence. It’s the same system producing both outcomes.
When safety stays labeled as a cost center, three things happen. Your budget gets cut first when revenue softens. Your projects get pushed to next quarter.
And the rest of the leadership team starts treating safety like a tax instead of a strategy. That’s the real cost of the cost-center story.
The reframe isn’t spin. It’s accounting. Every injury you prevent is revenue you keep, margin you protect, and a worker who stays on the line instead of leaving for the competitor down the road.
Once you can show that math, the budget conversation changes. The same project that looked like a $50,000 expense last year looks like a $200,000 prevented loss this year. That’s the reframe in action, and it’s what separates safety professionals who get funded from those who don’t. For more language to use in that conversation, see 10 ways to make the business case for safety.
The Real Numbers Behind Safety as a Profit Center
Here’s the data the National Safety Council and the Liberty Mutual Workplace Safety Index use to track this. Manufacturing companies pay for injuries whether they invest in prevention or not. The only question is whether they’re paying upstream or downstream.
Direct vs. Indirect Costs of a Manufacturing Injury
Most safety professionals only see the direct cost: the workers’ comp claim, the medical bills, the indemnity payment. That’s the visible part. OSHA and NIOSH research show the indirect costs run 2 to 10 times higher.
Indirect costs are the invisible drain. Overtime to cover the missing worker. Hiring and training a replacement. Lost production while the line runs short-handed. Quality scrap from a new hire still learning the job.
Investigation time and rising insurance reserves stack on top of that. None of it shows up on the workers’ comp invoice, but all of it lands on the P&L.
| Cost Category | What’s Included | Typical Range |
|---|---|---|
| Direct costs | Workers’ comp, medical, indemnity | $15,000 to $30,000 per claim |
| Indirect costs | Lost productivity, overtime, training, quality losses | 2 to 10x direct cost |
| Total per lost-time injury | Both combined | $40,000 to $60,000+ |
The $1-to-$4-to-$6 Return
OSHA cites research showing more than 60% of CFOs reported each $1 invested in injury prevention returns $2 or more. The ASSP ROI white paper pushes that number higher, citing $4 to $6 returned per $1 invested when you capture both direct and indirect savings.
That’s not a marketing number. It’s the floor. Manufacturers running mature Safety Management Systems routinely report ROI multiples in that range or higher because prevention scales.
One Servicemaster case in the ASSP paper shows a $2.4 million reduction in workers’ comp costs over two years after a safety program rebuild. That’s the kind of number that ends budget debates.
THE ALL-ACCESS PASS RESOURCE PAGE
Get all the FREE templates, safety management resources, PDFs, spreadsheets, and more...
How Safety Investments Drive Manufacturing Profit
The ROI numbers above are the proof. The mechanism behind them is what makes the profit center reframe stick with operators and finance leaders.
OEE Climbs When Injuries Drop
Injuries hit all three pillars of Overall Equipment Effectiveness. Availability drops when a line stops for an incident or a missing worker. Performance drops when crews slow down out of caution or work shorthanded.
Quality drops when inexperienced replacements run unfamiliar equipment. Fewer injuries means fewer interruptions to your highest-revenue asset: the people running the line.
Turnover Drops in Plants That Take Safety Seriously
Workers don’t leave bad pay as fast as they leave unsafe conditions. The DOE and ASSE both cite consistent investment in safety as a driver of lower absenteeism and turnover.
In a tight manufacturing labor market, every employee retained is replacement cost saved. That’s tens of thousands of dollars per worker, every year, that never shows up on the safety budget line.
For a closer look at what this looks like in practice, read the bottom-line benefits of a world-class safety program.
Insurance Premiums Track Your Loss History
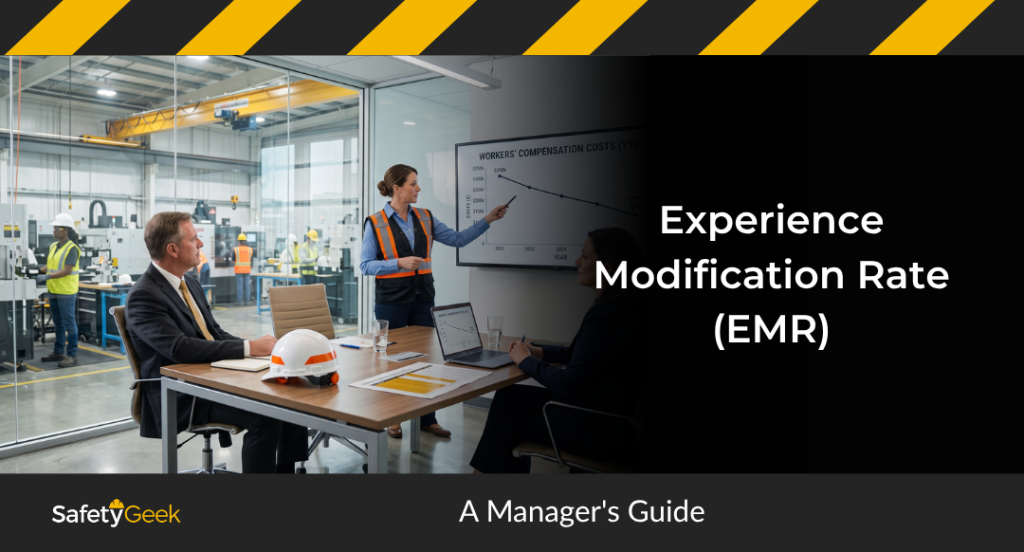
Your experience modification rate (EMR) is built on your last three years of claims. Every recordable, every lost-time injury, every dollar of indemnity rolls into the next renewal.
A plant with a 0.85 EMR pays roughly 30% less for workers’ comp than the same plant with a 1.15 EMR. Multiply that by your annual premium and you’ll see the line item your CFO already cares about.
How to Make the Profit Center Case to Your CFO
Most safety professionals walk into the executive office with binders of OSHA citations. That’s the wrong tool. CFOs don’t speak compliance. They speak cash flow.
What they want is a clean before-and-after picture, denominated in dollars they can move. Three numbers do that job. And you can build all three from data you already have.
The Three-Number Conversation
Number one: prevented loss. Use OSHA’s $afety Pays calculator to convert your most recent injury rate into the sales required to cover those losses at your operating margin.
Number two: recovered capacity. Take your average minutes of downtime per incident, multiply by incidents per year, then multiply by margin per minute on the affected line. That’s recovered revenue, not avoided cost.
Number three: retained headcount. Calculate your turnover cost (typically 33% of annual salary) and apply it to the workers you’d lose without a credible safety program.
Run those three numbers and your safety request stops sounding like an expense. It starts sounding like a portfolio investment with a known return. For more on framing the conversation, see how to tweak your communication with management.
This is also where visible management commitment kicks in. Once executives see the math, your job shifts from selling safety to maintaining momentum.
Frequently Asked Questions
Is safety really a profit center or is that just marketing language?
Safety is a profit center when you count what it prevents. Workers’ comp claims, downtime, scrap, turnover, and insurance premiums all hit margin. Prevent those losses and the prevention spending pays for itself, often several times over. OSHA, NSC, and ASSP all back this up with published data.
What’s the average ROI of a safety program in manufacturing?
Most research lands between $2 and $6 returned for every $1 invested when both direct and indirect costs are tracked. The high end shows up in mature programs with a working Safety Management Cycle, strong leading indicators, and visible leadership involvement. The low end shows up in compliance-only programs that treat safety as paperwork.
How do I calculate safety ROI for a specific project?
Start with the loss you’re preventing. Pull your historical incident data for the hazard, apply NSC or OSHA cost-per-incident figures, then add indirect costs at a 3 to 5 times multiplier. Compare that prevented loss against project cost over a three-year window. That ratio is your ROI, and it’s the number to bring into the budget meeting.
What if leadership won’t fund safety after seeing the numbers?
Two things are usually happening. Either the numbers aren’t tied to a metric the CFO already tracks, or leadership doesn’t trust the safety program to deliver. Fix the first by translating ROI into OEE, EMR, or turnover. Fix the second by building a credible Safety Management System and showing leading-indicator wins before asking for big budget.
How is this different from just complying with OSHA?
Compliance keeps you out of court. Profit center thinking keeps you in business. OSHA is the floor, not the goal. The plants running well above OSHA’s minimum standards are also the plants running the best margins, because the same systems that produce safety produce reliable operations.
Now It’s Your Turn
Reframing workplace safety as a profit center in manufacturing isn’t a slogan. It’s an accounting exercise, a system change, and a leadership conversation. Most safety professionals already have the data. They just haven’t translated it into language the executive team rewards.
If you’re tired of fighting for budget every year while watching preventable losses pile up, the next step is a Safety Leadership Roadmap Session. You’ll leave with a clear 90-day plan to install the systems and influence strategies that turn safety from a cost line into a strategic asset.
Book your Safety Leadership Roadmap Session here and bring the three numbers from this guide. We’ll build the case together.
Hi, I'm Brye (rhymes with sky)! I am a self-proclaimed safety geek with two decades of general industry safety experience. Specializing in bringing safety programs to a world-class level and building a safety culture, I have trained and coached many safety managers, just like you, on how to effectively manage workplace safety in the real world. I would love to help you too.